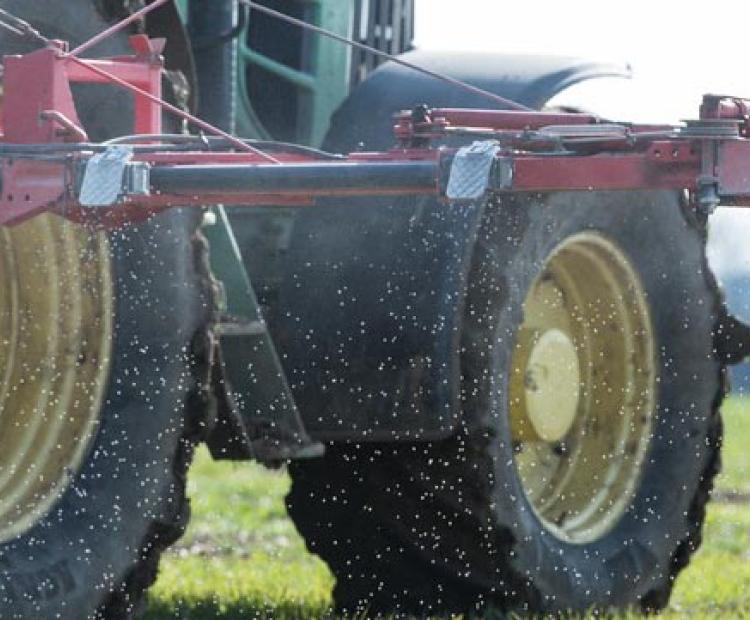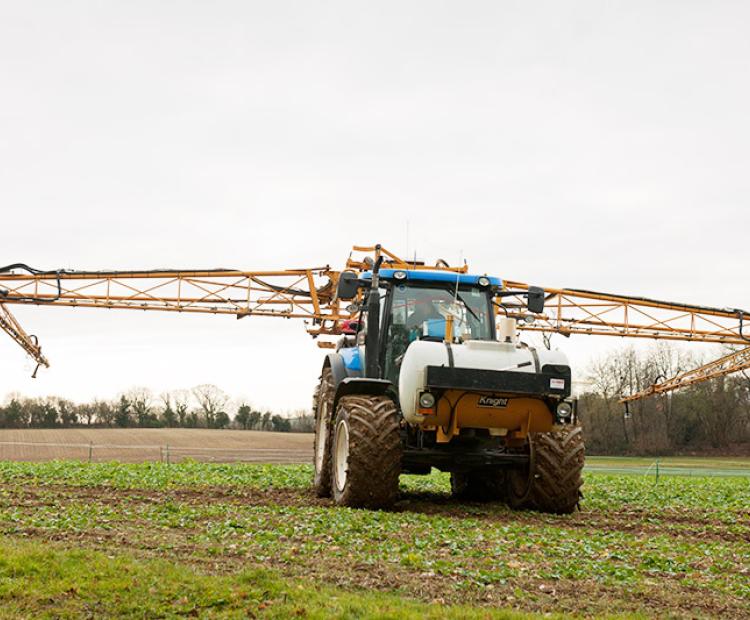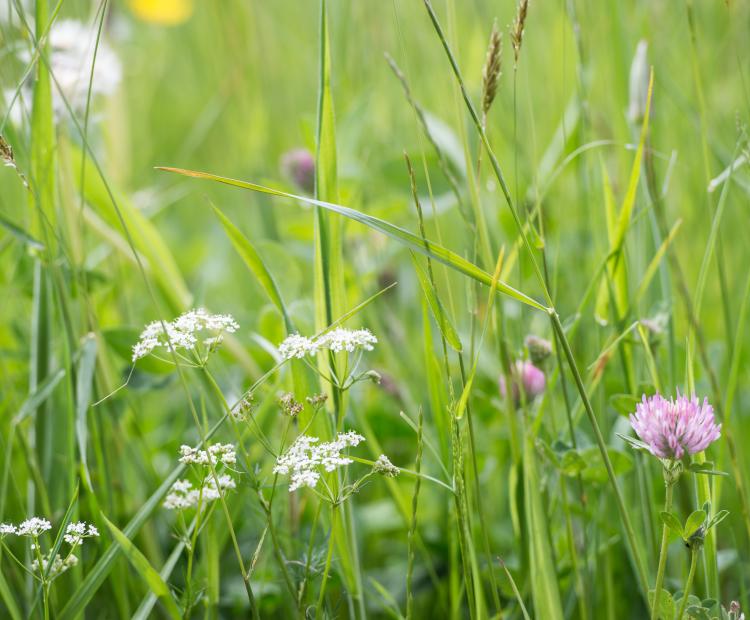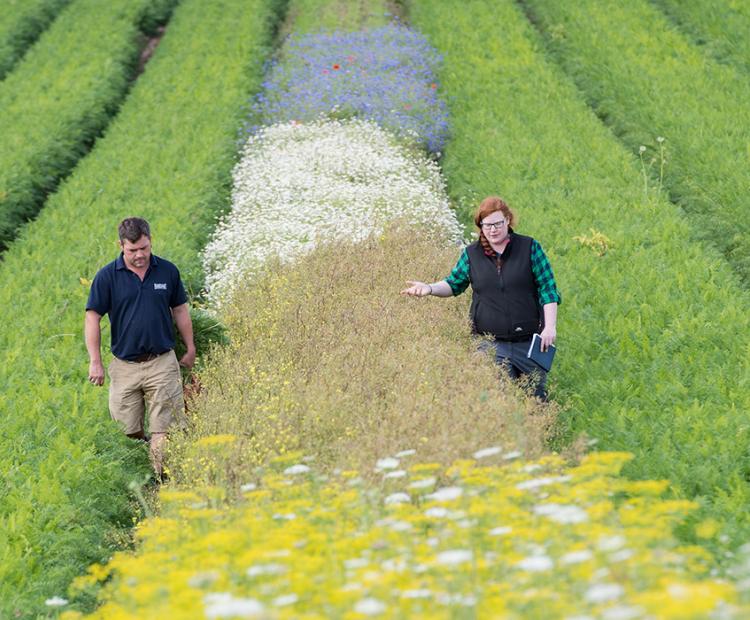
The big picture: using wildflower strips for pest control
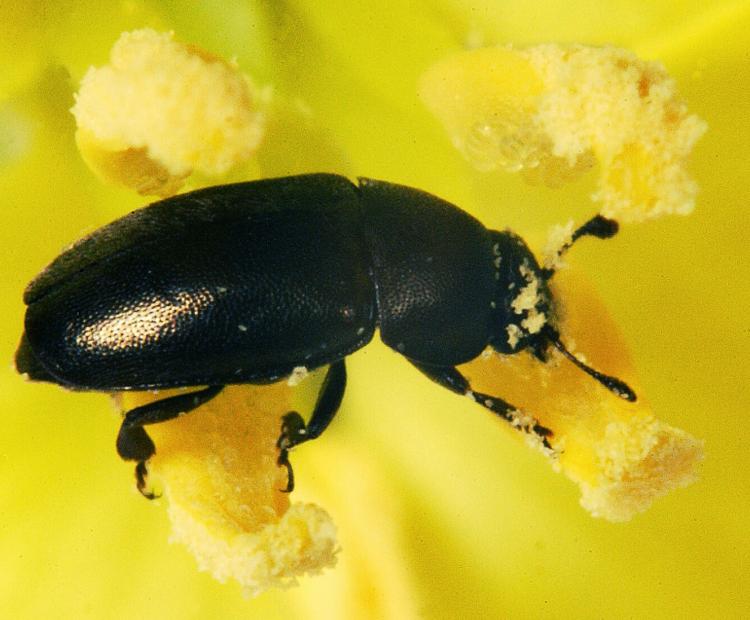
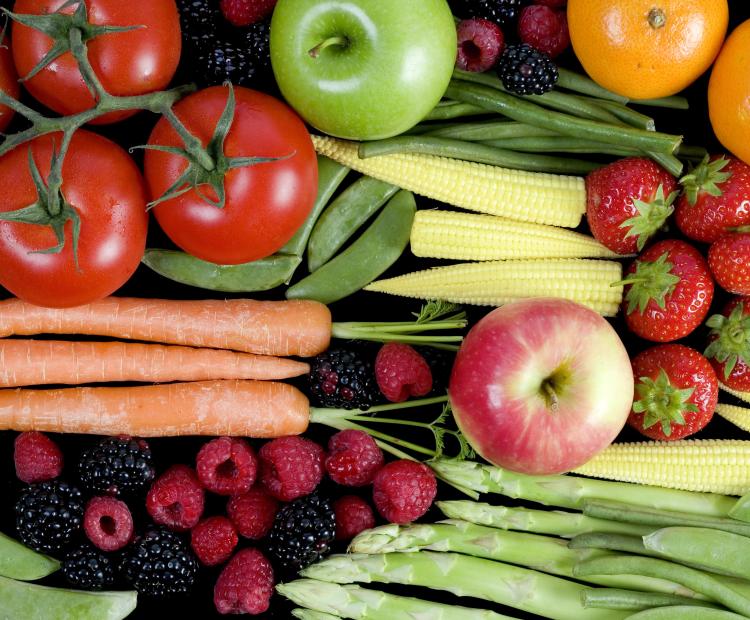
They may be beautiful, but these strips prove pretty deadly for every farmer's mortal enemy: aphids
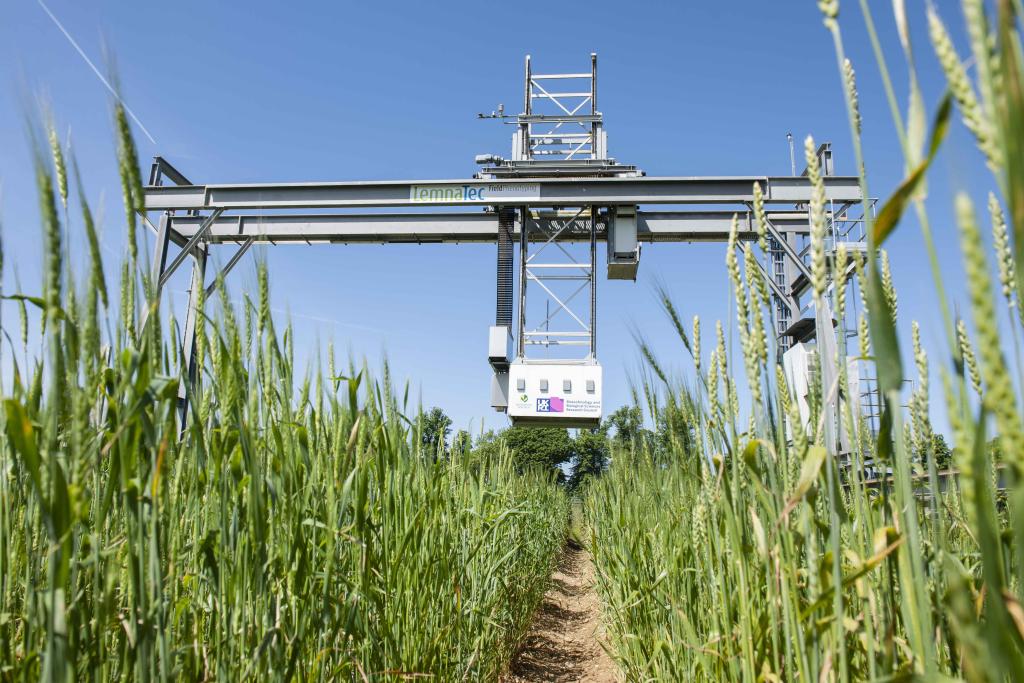
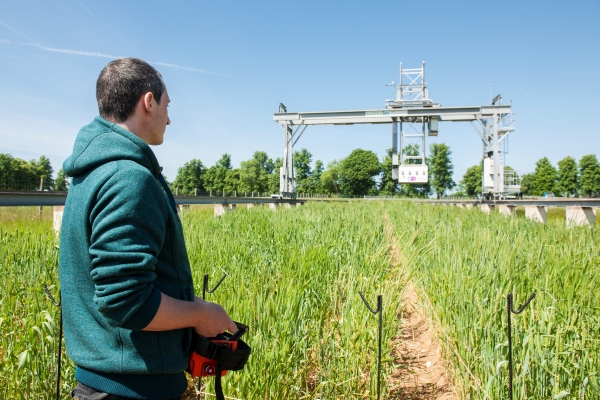
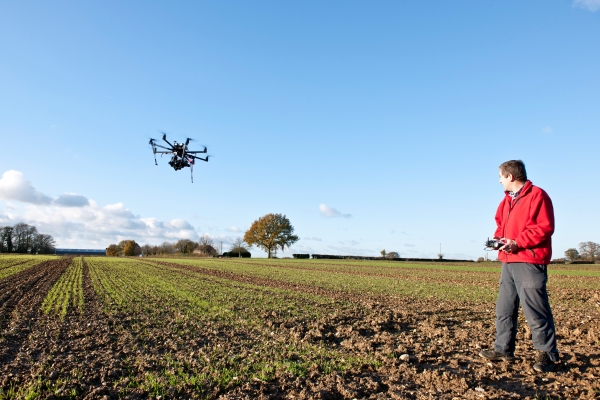
Rothamsted is a world leader in in-field phenotyping. We use both free flying drones (UAVs) and a fixed platform known as the "scanalyzer".
This device was the world’s first field crop analytics facility and continues to be supported by Rothamsted Research and the BBSRC. The Field Scanalyzer comprises of a gantry that supports a motorised measuring platform with multiple sensors. Crops within a 15m x 120m area can be monitored throughout the season with a high degree of resolution and reproducibility.
The facility is fully automated and can operate 24 hours per day throughout the year. On board illumination facilitates the data collection and sensors for simultaneous and non-destructive analyses of plant growth, morphology and physiology. Together, the data obtained from the panel of sensors provides a complex picture of plant growth and vigour.
The Field Scanalyzer is robust enough to cope with harsh environmental conditions with high sampling frequency, which provides information concerning the varietal responses to the extrinsic environment and their effect on yield.
At Rothamsted, drones have been used for phenotyping since 2014. For this work the institute has a CAA Operational Authorisation, insurance, and the pilots have the required recognised qualifications.
Flights are usually carried out weekly through the growing season, amounting to around 26 flights per experiment per year.
At their simplest, the drones carry conventional (RGB) digital cameras, and from the images crop height (using photogrammetry software) and crop cover can be calculated.
At the next level, multispectral cameras are carried, taking near infrared images as well as RGB, and from these various crop growth indices can be calculated, such as Normalised Difference Vegetation Index (NDVI).
Rothamsted also has a 3D hyperspectral capable drone, and this produces 3D hyperspectral images, with 540 wavebands between 400 and 2500nm. The datasets are huge, and from the data many published growth indices can be calculated, the data can also be used in chemometric software, alongside ground truth data, to produce calibrations for estimating crop traits from hyperspectral data.
A thermal camera can also be used to measure canopy temperature. This is a useful estimate of drought stress.
Data pipelines have been developed at Rothamsted for each sensor. At the first stage, geo-located ortho mosaics are produced, then overlayed with shape files and plot data extracted.
Further work is required to fully exploit the hyperspectral data and to look at intra-plot variation.
Designing Future Wheat (ISP) Leader

PHENOTYPING COMPUTER VISION SCIENTIST
Agronomist
Scientific Specialist – Field Phenotyping
Rothamsted Field Phenotyping and Scanalyzer
Rothamsted Research
Harpenden
Hertfordshire
AL5 2JQ
Tel: +44 (0)1582 763 133
Email: malcolm.hawkesford@rothamsted.ac.uk