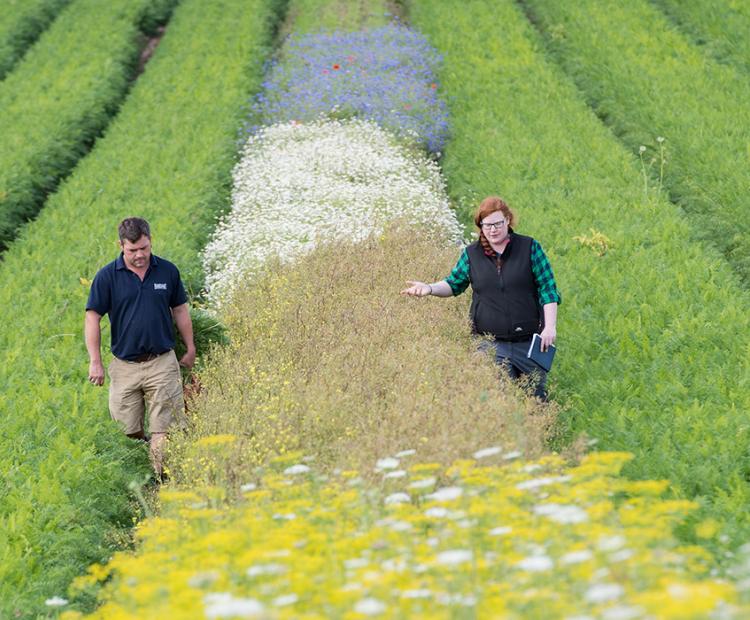
The big picture: using wildflower strips for pest control
They may be beautiful, but these strips prove pretty deadly for every farmer's mortal enemy: aphids


Farm Crap App Designed to help farmers make the most of their manure (slurry, farmyard manure and poultry litter). The free app contains 3 components; the calculator, the image library (to which you can add your own photos), and the record sheets. The calculator will determine the amount of crop-available key nutrients (nitrogen, phosphorus, potassium) within the manure at different spreading rates helping you decide how much to spread in order to meet the crop requirements.
Download the app for Android and Apple.
Contact: Robert Dunn

This interactive map provides catchment-specific apportionment of nitrate and nitrous oxide emissions from intensively managed farms by different combinations of sources and source areas across England. Key sources include chemical fertilisers, livestock and the soil matrix and the main source areas cover arable fields, grass fields and non-field farm components, such as livestock housing. Overall emissions and relative source contributions are shown visually for a selected Water Management Catchment in England. This information could be used by catchment managers, national policy makers and interested researchers to target mitigation efforts for the purpose of undertaking an impact assessment and evaluating cost and benefits.
Contact: Yusheng Zhang
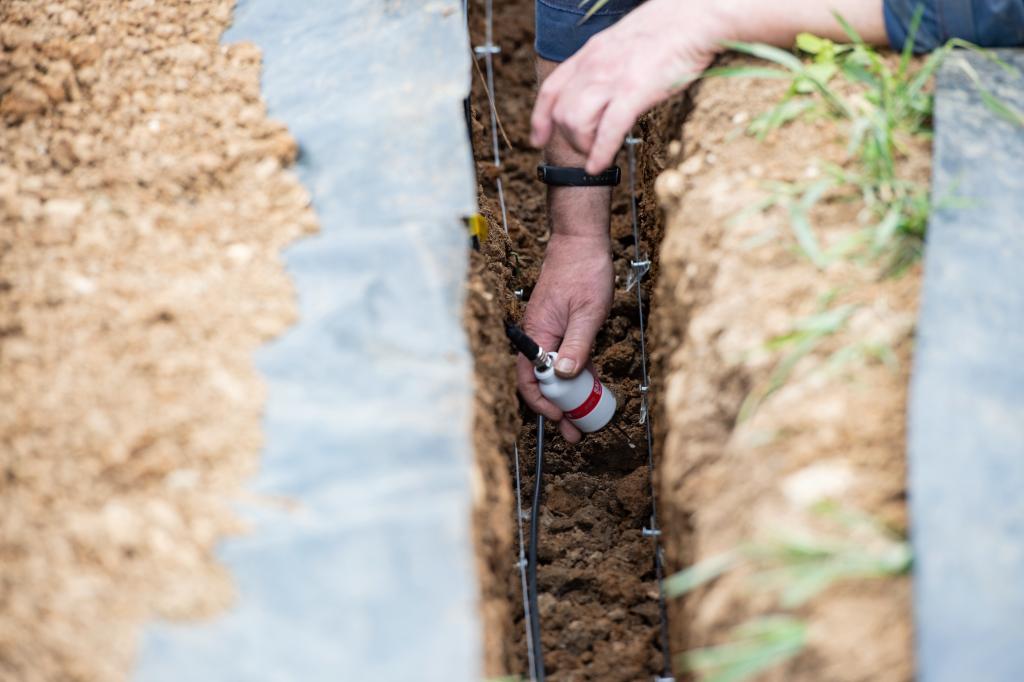
Use of nitrate and urease inhibitors represents one of the nitrogen management practices which can contribute to the mitigation of GHG emissions associated with the use of fertilisers in agricultural settings. Their efficacy and impacts are affected by multiple environmental and management factors, including climate conditions, surface soil properties, soil moisture status and fertiliser use. Against this background, area-specific information has been processed and mapped for Water Management Catchments across England and presented in an interactive web map. It could be used by catchment managers, policy makers and interested scientists to assess the quantification of inhibitor efficacy and their environmental and economic effects at management scale.
Contact: Yusheng Zhang