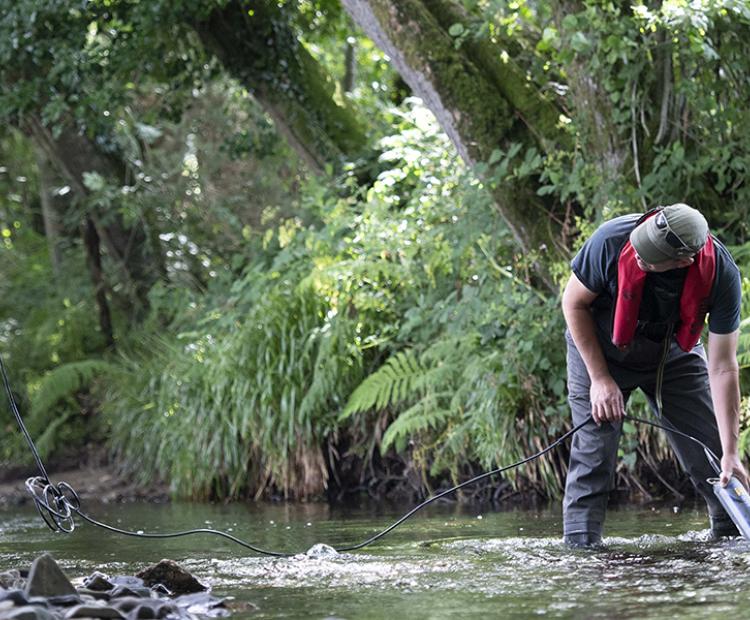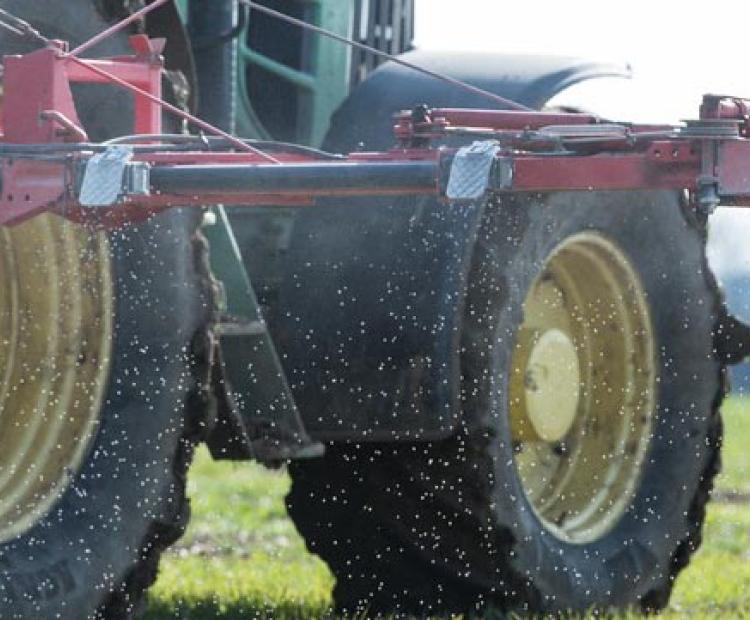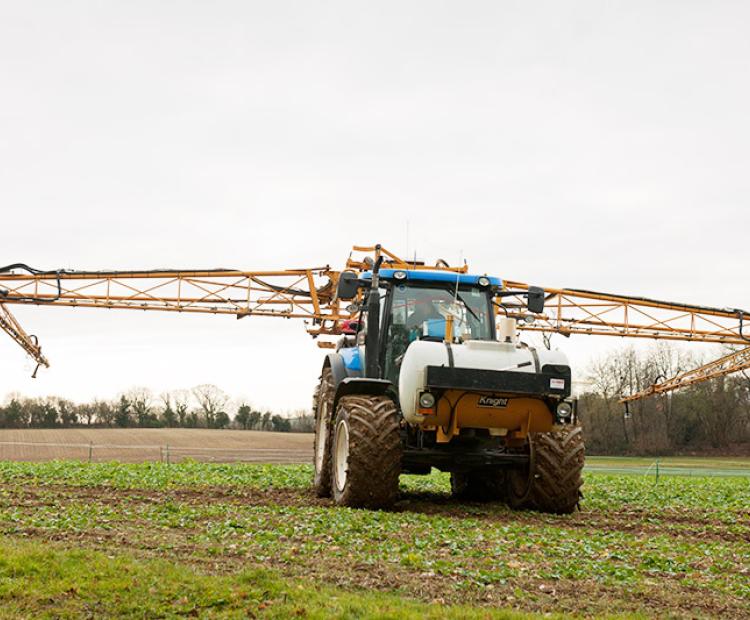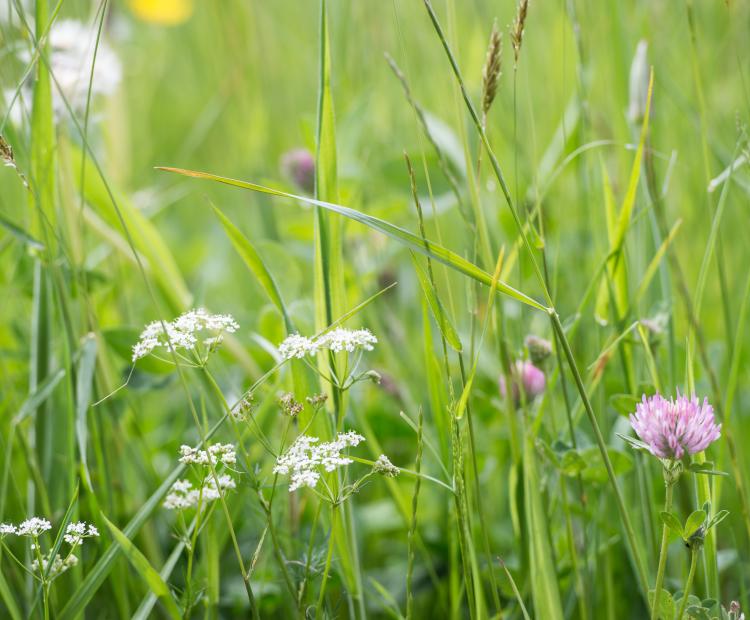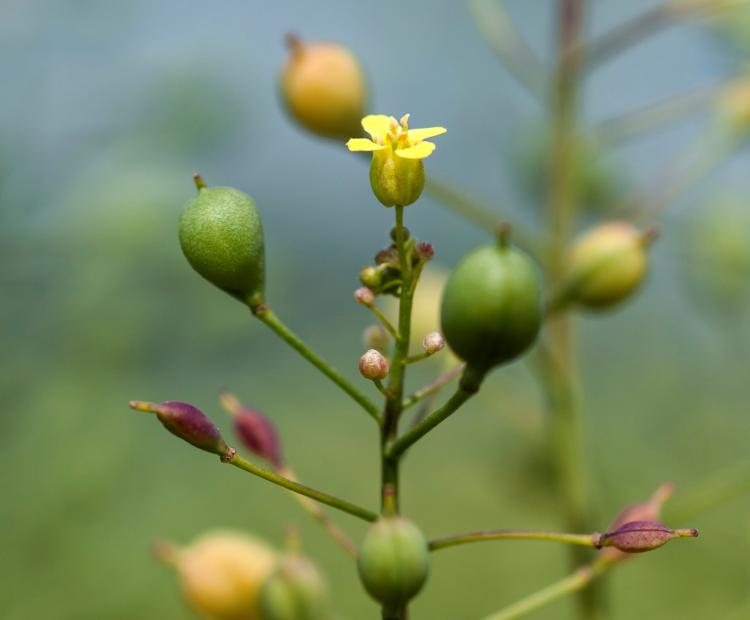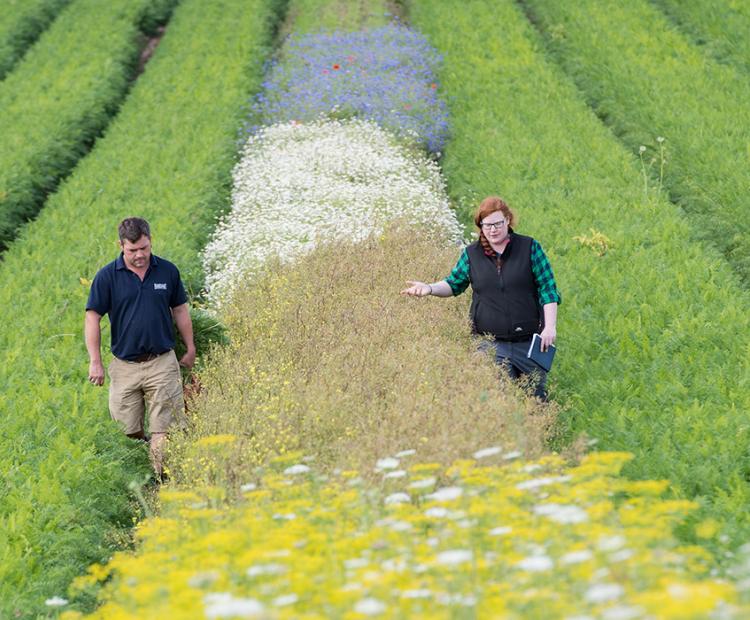
The big picture: using wildflower strips for pest control
They may be beautiful, but these strips prove pretty deadly for every farmer's mortal enemy: aphids
Data supplied by ECN Rothamsted (ECN AWS T06 02; Harpenden Meteorological Station)
Change of rain gauge and the effect on rainfall capture and data presented in Monthly Weather Summaries.
Rainfall up until 2004 was measured manually using a cylindrical rain gauge of five inch diameter (5") within a turf-wall enclosure to reduce wind turbulence. In 2004 the Met Station at Rothamsted was automated and the 5" rain gauge replaced with an aerodynamically shaped tipping bucket rain gauge of ten inch diameter (type ARG100) within the enclosure. The manufacturers of the ARG100 state that "the ARG100 raingauge typically captures over 5% more rainfall than most traditionally-shaped cylindrical gauges due to its unique aerodynamic shape and reduced evaporation-loss properties". This has been found to be the case at Rothamsted. When we have compared the ARG100 with the 5" we get a difference of approximately ten percent over an eight year period (2004 to 2011).
We have therefore decided not to correct rainfall data but to advise that this difference exists. This does however mean that the 30 year average rainfall data are to be considered for use as guidance only.
Table of warnings about 30 year rainfall averages |
||
|---|---|---|
|
30 Year Average |
Associated Weather Summary Table |
Status |
|
1971 to 2000 (5" only) |
2001 to 2010 |
up to 2003 - OK |
|
1981 to 2010 (5" and ARG100) |
2011 to 2020 |
guidance only |
|
1991 to 2020 (5" and ARG100) |
2021 onwards |
guidance only |

**Mean air temperature is calculated daily as the maximum air temperature (Max) plus the minimum air temperature (Min) divided by two i.e. (Max+Min)/2
|
Variable
|
Number of Years
|
From : To
|
|---|---|---|
|
Maximum air temperature
Minimum air temperature Mean air temperature Total Rainfall Total Sunshine |
100
|
1891 to 1990
|
|
Soil temperature at 10cm under bare soil
Soil temperature at 20cm under bare soil |
60
|
1931 to 1990
|
|
Soil temperature at 30cm under bare soil
|
48
|
1931 to 1990 (1) |
|
|
|
(1)Excluding 1945 - 1956 |